Strategic Objective 3.1
Advance understanding and predict changes in the Earth’s environment to meet America’s economic, social, and environmental needs
The Department’s role in understanding, observing, forecasting, and warning of weather events is expanding. The Department is conducting sound, scientific research and providing integrated observations, predictions, and advice for decisionmakers who manage environmental resources, ranging from fresh water supplies to coastal ecosystems to air quality. Realizing that the Department’s information and services bridge both weather and climate timescales, the Department will continue to collect and analyze environmental data and issue forecasts and warnings that help protect life and property and enhance the U.S. economy. The Department is committed to excellent customer service and depends on its partners in the private sector, academia, and government to add value and help disseminate critical weather and climate information. The Department will expand services to support evolving national needs, including those associated with space weather, freshwater and coastal ecosystems, and air quality prediction.
Performance Objective: Serve society’s needs for weather and water information (NOAA)
|
|||||||||||||||||||||||||||||||||||||||||||||||||||||||||||||||||||||||||||||||||||||||||||||||||||||||||||||||||||||||||||||||||||||||||||||
| Rating | Results |
|---|---|
| Exceeded Target | 2 |
| On Target | 8 |
| Slightly Below Target | 0 |
| Below Target | 0 |
| See Appendix A: Performance and Resource Tables for individual reported results. | |
In FY 2007, NOAA continued its leadership in weather and water science and technology by expanding sources of observational data, advancing numerical models, and improving the accuracy of its forecasts and warnings. In addition, NOAA responded to society’s evolving needs for forecast services by leveraging its partnerships in the public, private, and academic sector.
Some highlights from FY 2007 include:
The Fire Weather Dynamic Point Forecast Matrix (PFM), an experimental Web-based product, is helping land managers and fire agency officials better plan for and manage fire activity, from prescribed burns to large wildfires. Activated in January 2007, PFM is available across the western United States and provides dynamic forecast updates with enhanced usability for fire management, including Lightning Activity Level, Haines Index, and smoke management variables. More efficient fire administration results in cost savings to the Nation and improved management of U.S. public lands and forest ecosystems. A typical weather forecast is produced for seven days, every three hours for the first three days and then every six hours for the last four days. PFM allows fire agencies to access a Web-based tool. By clicking on a map, fire agencies are able to quickly receive a Dynamic Forecast generated from the latest information available.
To achieve 100 percent coverage of high-risk areas, NOAA added 17 broadcast stations to the network in 2006 and 2007. In addition, NOAA refurbished 62 broadcast stations with technology upgrades that significantly improve reliability and availability while decreasing maintenance costs. Refurbishing these older broadcast stations and installing new broadcast stations allow the network to meet expectations of availability as the Nation’s weather and all hazard warning system. NOAA Weather Radio All Hazards is a reliable and inexpensive means of communicating weather, hazard, and emergency information directly to the public. The network infrastructure consists of over 972 broadcast stations covering 98 percent of the Nation’s population and has the ability to deliver messages to individuals monitoring their own receivers as well as the ability to reach millions of listeners and viewers through the Emergency Alert System, which is monitored by television and radio license holders.
The network is required to broadcast to all areas identified in the United States as being at high risk of experiencing severe weather and to sustain a high level of reliability and maintainability in those areas. NOAA categorizes 248 areas in the United States as being at high risk of experiencing severe weather events, including tornados, hurricanes, flash floods, flooding, severe winter weather, and severe marine weather.
Recognizing the dangers of excessive heat conditions, NOAA has exceeded its goal for implementing the Heat Health Watch/Warning Systems (HHWS). NOAA’s NWS forecasters will use this system to help predict severe heat conditions that adversely affect human health and endanger life.
NWS successfully implemented two HHWSs in San Francisco/San Jose, CA and Houston, TX in May 2007. The California HHWS is a multi-city system with funding contributed by San Jose’s Office of City Emergency Services, helping NWS to exceed its HHWS coverage goal for 2007. This brings the total number of HHWSs to 19, covering 29 cities.
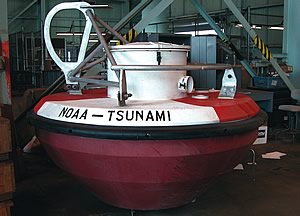 A DART buoy located at the NOAA NDBC at Stennis Space Center, MS. |
The National Data Buoy Center (NDBC) is responsible for the expansion of the U.S. network of tsunami detection sensors. During FY 2007, 14 Deep-Ocean Assessment and Reporting of Tsunamis (DART) buoys were established in the Western Pacific Ocean (4), off the Pacific Coast of Central America (3), in the North Western Pacific Ocean (5), and in the North Atlantic Ocean (2) bringing the total number of U.S. DART stations to 34. The DART project is an ongoing effort to maintain and improve the capability for the early detection and real-time reporting of tsunamis in the open ocean. DART provides tsunami hazard mitigation and warnings and capacity building in the international tsunami community.
In addition, NWS works with communities to prepare for tsunamis through the TsunamiReady program. To date, there are 42 TsunamiReady sites in nine states, Puerto Rico, and Guam. NWS reached its goal of recognizing 10 new TsunamiReady communities in FY 2007.
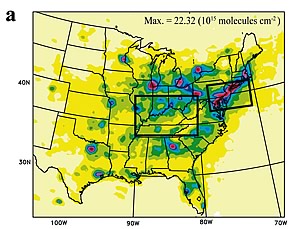 NOAA image of the Ohio River Valley showing a decline in nitrogen dioxide. |
A major smog-forming pollutant is declining over the eastern United States, according to a new study by scientists at NOAA and the University of Bremen, Germany. New satellite observations mark the first time space-based instruments have detected the regional impact of pollution controls implemented by coal-burning electric power plants in the 1990’s. The findings were published in Geophysical Research Letters, a publication of the American Geophysical Union.
High-precision instruments aboard European satellites have detected a 38 percent decline in nitrogen dioxide (NO2) in the Ohio River Valley and nearby states between 1999 and 2005, according to the study. NO2 and nitric oxide (NO) are two gases that form a group of pollutants known as nitrogen oxides (NOx), which are created primarily through fossil fuel burning. When combined with other gases and sunlight, they form ozone, the major urban air pollutant in smog. Ground-level ozone harms human health and vegetation and is a key pollutant targeted by the Environmental Protection Agency (EPA). The next step is to confirm through observations and further analysis that ozone is actually declining, advises Si-Wan Kim, of the Earth System Research Laboratory (ESRL) and the Cooperative Institute for Research in Environmental Sciences and lead author of the study. “NOAA scientists and their colleagues have provided an objective assessment of the positive impact on Earth’s atmosphere of actions taken by industry with the ultimate goal to improve air quality over the eastern United States,” said Richard W. Spinrad, Ph.D., assistant administrator of NOAA Research. “This work is an excellent example of NOAA’s value to society as an objective science broker.”
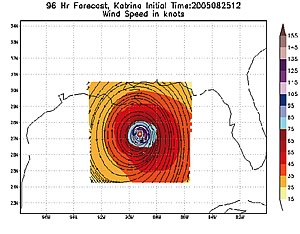 NOAA image showing the HWRF 96-hour (4-day) forecast for Hurricane Katrina, heading for New Orleans in 2005. |
Understanding hurricane intensity is one of NOAA’s greatest challenges. To that end, the National Centers for Environmental Prediction (NCEP) implemented the Hurricane Weather Research and Forecast (HWRF) Model operationally on June 19, 2007. It joins the Geophysical Fluid Dynamics Laboratory Hurricane Model to provide operational hurricane guidance forecasts for the 2007 hurricane season. The new model will improve forecast accuracy by better addressing the intensity, structure, and rainfall forecast problem in addition to advancing wave and storm surge forecasts. “It is vital that we understand all the factors of hurricane forecasting throughout the life of a storm and HWRF will provide an unprecedented level of detail. Over the next several years, this model promises to improve forecasts for tropical cyclone intensity, wave and storm surge, and hurricane-related inland flooding,” said Mary Glackin, acting director of NWS. “It will be one of the most dynamic tools available for our forecasters.”
Over the next three years the model will be upgraded to include advanced data assimilation for the hurricane core, making use of observations from airborne Doppler radar and land based radars, and it will be coupled to an advanced version of the operational hurricane wave model. Additionally, a land surface component will improve forecasting of inland flooding problems associated with hurricane land falls.
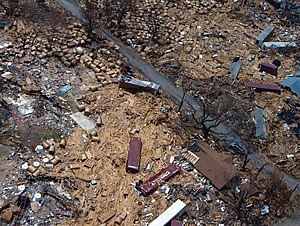 A view of the destruction from Hurricane Katrina in Biloxi, MS. |
During 2007, NOAA hurricane researchers investigated the destructive potential of land-falling hurricanes and indicated that the overall size of the storm, as well as the area reached by its winds should be considered when assessing its possible damage.
In April 2007 the Bulletin of the American Meteorological Society published a study by a research meteorologist at the NOAA Atlantic Oceanographic and Meteorological Laboratory in Miami describing a new Hurricane Destructive Potential classification. The new proposed metric associates a numerical value similar to the Saffir-Simpson scale to each storm, and reflects potential damage due to wind, storm surge, and waves. The overall goal is to provide a better measure of the threat posed by a hurricane.
NOAA has successfully integrated a new wind speed measuring instrument into the broader U.S. hurricane reconnaissance arsenal, the Stepped Frequency Microwave Radiometer (SFMR). As of July 2007, the U.S. Air Force Weather Reconnaissance Squadron has outfitted three of its C-130 hurricane hunter aircraft with SFMRs, with the goal of outfitting one new aircraft per month through the rest of 2007, and an ultimate goal of outfitting each aircraft in the squadron. NOAA’s two P-3 hurricane hunter aircraft are already outfitted with SFMRs with plans for the Gulfstream-IV jet to be outfitted in the next year.
The SFMR uses remote sensing technology to measure wind speeds directly below the aircraft when flying in the hurricane environment. The algorithms that are used to convert raw SFMR data into highly accurate surface wind speed estimates were developed by NOAA hurricane researchers at the Atlantic Oceanographic and Meteorological Laboratory. Wind speeds from SFMRs provide a wealth of precise data on a storm’s current wind speeds that were previously only available in the form of sporadic data points from air-deployed instruments or flight level estimates. This significantly improves NOAA’s ability to accurately describe a hurricane’s strength and also improves model output by more completely and accurately describing the current conditions.
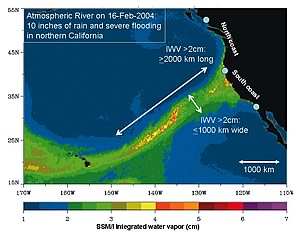 NOAA image of the Hydrometeorology Testbed-West 2007 Basin Scale Domain. |
Early tests of the Phased Array Radar system by the National Severe Storms Laboratory (NSSL), working with private sector partners, including Lockheed Martin, show that this innovative technology, developed by the Department of Defense (DOD), has the potential to vastly improve upon the capabilities of the national Next Generation Weather Radar system (NEXR Hydrometeorology Testbed-West 2007 Basin Scale Domain. AD) radar network for all weather radar applications. Tests demonstrated a complete volume scan around the Multi-functional Phased Array Radar can be obtained in less than one minute, while the current NEXRAD radar takes five to six minutes for such a scan. This technology has the potential to increase the average lead time for tornado warnings well beyond the current average of 13 minutes. NSSL’s Phased Array Radar captured a number of significant severe and tornadic weather events during the spring storm season in 2007. For the first time these data were made available for operational use to the NWS Weather Forecast Office (WFO) in Norman, OK.
Researchers from the NOAA ESRL are intensively monitoring air, water, and soil in the American River basin between Reno, NV and Sacramento, CA. Part of a regional implementation of a national hydrometeorological testbed (HMT) program, ESRL scientists are working closely with NWS forecasters and hydrologists and other NOAA research laboratories to improve predictions of California’s heavy winter rains to help water resource managers prevent catastrophic flooding in the Sacramento region. New sensors, computer models, and other tools tested during the study eventually will be used to improve NWS rainfall forecasts up and down the West Coast through HMT’s efforts to enhance and accelerate research to operations.
FY 2007 saw the successful completion of the second full field season (late November through mid-March), and included several new instrumented sites as well as the addition of new experimental workstations distributed to three NWS WFOs and the California-Nevada RFC. These work stations delivered custom, river basin scale ensemble forecasts of rain and weather in the HMT area. A new water vapor flux product, using HMT atmospheric river observatory data, was developed and distributed for the first time this year—in mountainous terrain, rainfall is directly related to the water vapor flux. Rainfall estimates derived from high-resolution, gap-filling radars were delivered to NWS in support of the second Distributed (hydrologic) Model Inter-comparison Project (DMIP2). Motivated by HMT, data from the commercial KPIX radar in the San Francisco Bay area came online and are supporting the NWS WFO in Monterrey.
NOAA’s National Geophysical Data Center (NGDC) recently made the Global Historical Tsunami, Significant Earthquake, and Significant Volcano Databases available through Web Map, Web Feature, and Web Coverage services. This is the first step in providing these data to the Global Earth Observatory (GEO) community through the GEO Web Portal. This included a quality review of all major tsunami events in the World Data Center’s Global Historical Tsunami Database (http://www.ngdc.noaa.gov/seg/hazard/tsu.shtml). Each event reported, from 2000 BCE to the present, is carefully compared against and referenced to tsunami documents and published reports. The event database includes information on the tsunami source (i.e. earthquake, volcano, and landslide) and impacts (i.e. maximum inundation, deaths, and damage). A review of all events impacting U.S. coasts was completed in 2006 as the basis for release in 2007 of “Tsunami Hazard Assessment for U.S. Coasts.” These data are essential input to tsunami forecast models and warnings.
The NOAA Coastal Storms Program (CSP) managed by the Coastal Services Center (CSC) has developed a suite of products for Oregon and Washington coastal communities to improve storm planning, prediction, and recovery. The Pacific Northwest is vulnerable to flooding, debris flows, and coastal erosion because of battering coastal storms during the winter months. The impacts of these storms are quite diverse, ranging from treacherous navigation conditions at the mouth of the Columbia River (known as “the graveyard of the Pacific”) to stormwater impacts on spawning salmon. The products developed by CSP contribute to alleviation of hazard impacts to the region. Outreach and training for these products were provided through the Oregon Sea Grant Program and the Coastal Zone 07 conference in Portland, OR. Similar efforts are underway for Southern California and the Gulf of Mexico.
| Rating | Results |
|---|---|
| Exceeded Target | 1 |
| On Target | 4 |
| Slightly Below Target | 0 |
| Below Target | 1 |
| See Appendix A: Performance and Resource Tables for individual reported results. | |
Society exists in a highly variable climate system, with conditions changing over the span of seasons, years, decades, and centuries. Seasonal and interannual variations in climate, like El Niño, led to economic impacts on the order of $25 billion for 1997 to 1998, with property losses of over $2.5 billion and crop losses approaching $2.0 billion. Given such stresses as population growth, drought, and increasing demand for fresh water, it is essential for NOAA to provide reliable observations, forecasts, and assessments of climate, water, and ecosystems to enhance decisionmakers’ ability to minimize climate risks. This information supports decisions regarding community planning, business management, and natural resource and water planning. In the U.S. agricultural sector alone, better forecasts can be worth more than $300 million in avoided losses annually.
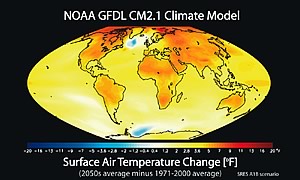
In FY 2007, NOAA continued its efforts to obtain the best science through the Climate Change Science Program (CCSP) and NOAA Climate Program. NOAA accomplished this through its continuing role as lead agency of the interagency CCSP. In addition, NOAA increased the production of climate information and services for decisions, including Synthesis and Assessment Reports, implementation of NIDIS, and completion of initial climate scenario runs for the Intergovernmental Panel on Climate Change (IPCC).
|
|
|
NOAA individuals and technology made major contributions to the IPCC international climate science report. The depth of NOAA’s contributions in this international effort, from a leadership role, highlights the preeminent science conducted by NOAA providing observations, data, model simulations, analysis, authors, and review editors. A cadre of NOAA scientists from the laboratories and programs, including the joint and cooperative institutes, served as contributors and government reviewers of the final report, which is a state-of-the-science report based on published peer-reviewed literature. Many of IPCC efforts were supported by NOAA and the U.S. CCSP.
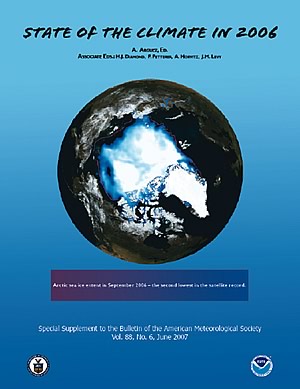
The State of the Climate in 2006 report, published as a special supplement to the June 2007 Bulletin of the American Meteorological Society, provides a summary of global climate conditions for the year. This 135-page report is the product of collaboration among 159 individuals from 33 countries. The goal of the annual report is to routinely analyze and report on a total of 42 atmospheric, ocean, and terrestrial climate “state” variables. The 2006 edition reported on 20 essential climate “state” variables. Two major highlights from the report include: the contiguous United States experienced the second warmest summer on record, and globally, it was the fourth warmest August on record on land and the ocean surface waters. To produce products such as this report, NOAA, through the auspices of the Climate Observations and Analysis (COA) Program, and the National Environmental Satellite, Data, and Information Service (NESDIS) line office, coordinates the analyses of current observations and places the recent measurements in context with historical observations. This NOAA cross line office activity requires adequate observational measurements, data management, and stewardship of those measurements, and a quantitative analysis of long-term trends and variations in the climate record. Reports such as these are part of NOAA suite of climate information products and allow policymakers and resource managers to make more informed decisions that have far reaching effects on the environment and socio-economic related issues.
NWS released its first official local climate outlook product for 1,000 locations nationwide, including Alaska and Hawaii. The Local 3-Month Temperature Outlook augments current climate services by providing local-level outlooks. The forecasts are produced monthly for 13 three-month forecast periods. This new product will, for the first time, give the agricultural industry, local government officials, and the public the ability to plan for longer term temperature events. The forecasts are available on national and local NWS Web sites under the heading “Climate” (http://www.weather.gov/climate/ l3mto.php).
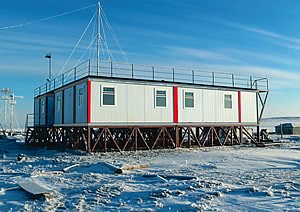 NOAA image of the newly constructed NOAA research station in Tiksi, Russia. |
During the summer of 2007, the NOAA ESRL expanded its Arctic observation with the construction of a new location in Tiksi, Russia, joining five existing laboratories placed internationally along the Arctic rim. It will be an important component of the NOAA Arctic Atmospheric Observatory Program, closing a significant gap in vital Arctic atmospheric research. This new observation station is an example of increasing international cooperation in Earth observation around the world. Information from the Tiksi research laboratory will provide scientists with a better understanding of the rates and processes of Arctic climate change, including the retreat of sea ice and permafrost. Tiksi was chosen for its geographically favorable atmospheric conditions consisting of very clean and clear air, which will provide the greatest possible measurements of solar radiation, aerosols, air chemistry, trace gases, cloud properties, water vapor, ozone, temperatures, winds, and stratospheric properties.
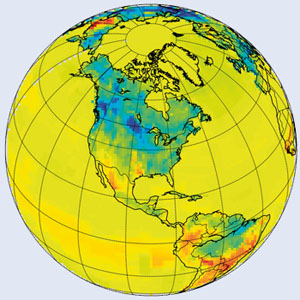 NOAA snapshot of the surface uptake of CO2 across North America showing the strongest CO2 sinks (blue colors) in the East Coast forests, coniferous forests in Canada and the U.S. Midwest. Note that the largest carbon cycle component, the fossil fuel emissions, is not shown on this map. The image represents a week in July of 2005 and illustrates one of the many products in CarbonTracker. |
Scientists from the NOAA ESRL launched a new tool called CarbonTracker to monitor changes in atmospheric carbon dioxide and other greenhouse gases by region and source. CarbonTracker will enable its users to evaluate the effectiveness of their efforts to reduce or store carbon emissions. The online data framework distinguishes between changes in the natural carbon cycle and those occurring in human-produced fossil fuel emissions. It also provides verification for scientists using computer models to project future climate change. Potential users include corporations, cities, states, and nations assessing their efforts to reduce or store fossil fuel emissions around the world.
In mid-January the WMO/UNEP (World Meteorological Organization/United Nations Environment Programme) publicly released the “Scientific Assessment of Ozone Depletion: 2006.” The 2006 report describes past and expected future levels of ozone-depleting substances, past and expected future behavior of the ozone layer in polar regions and throughout the globe, implications for ultraviolet radiation at the Earth surface, short-lived ozone depleting substances, and interrelationships between climate and ozone depletion. NOAA scientists have played prominent roles in leading, authoring, contributing to, and reviewing the 2006 ozone assessment. In addition, scores of NOAA-authored scientific papers are cited in the eight detailed scientific chapters of the report. NOAA, through its prominence in leading, authoring, and publishing the report, reaches a truly global set of customers and these efforts directly serve NOAA’s goal of providing scientific information in support of decision-making.
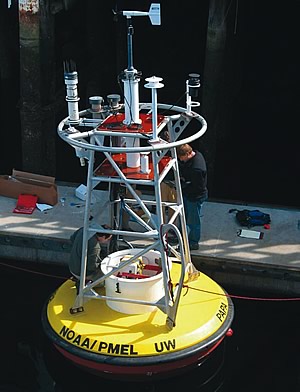 NOAA scientists and technicians making final adjustments on the first buoy to carry equipment that measures ocean acidification. This buoy was deployed on June 7 in the Gulf of Alaska. |
The first buoy to monitor ocean acidification, a result of carbon dioxide absorbed by the ocean, has been launched in the Gulf of Alaska and is a new tool for researchers to examine how ocean circulation and ecosystems interact to determine how much carbon dioxide the North Pacific Ocean absorbs each year. This project is a collaboration between the NOAA Pacific Marine Environmental Laboratory, the University of Washington, Fisheries and Oceans Canada, and the Institute of Ocean Sciences in Sidney, BC.
In terms of performance, the only target NOAA missed was the sea surface temperature error in the climate variability outcome. This measure is a key measure, perhaps the most important measure for the climate outcome. Accuracy of sea surface temperature measurements impacts much of NOAA’s long-term work in the climate area, particularly with regard to predicting serious events such as hurricanes. The target for this measure remained the same for FY 2006 and FY 2007, and NOAA did not meet it either year. Furthermore, the explanation for not meeting the target both years was essentially the same even though NOAA stated in FY 2006 they were taking steps to improve the performance in FY 2007.
The Department utilizes several strategies, identified in the five-year NOAA strategic plan, to improve accuracy and timeliness of weather and water information. Improved weather and water information can have a profound impact on the economy. The Department strives to ensure that reliable, accurate, and timely weather and water information is available for informed and reasoned decision-making. Strategies to achieve this end state include:
One of NOAA’s top priorities is to effectively and efficiently deliver information and services to customers when they need it and in standardized formats. NOAA strives to support a safer, healthier, and economically stronger United States through reliable, timely, and accurate weather and water information. NOAA-wide information such as all-hazards warnings and a wide range of environmental information from an expanding customer base must be available in digital formats with the necessary supporting infrastructure.
NOAA must continue to refine its Earth observing architecture and data management infrastructure in order to increase its capacity to meet the information requirements of NOAA’s four mission objectives. NOAA’s mission objectives are directly related to the “nine societal benefit areas” identified by the intergovernmental GEO and the U.S. GEO (USGEO). As such, NOAA will continue to be an active participant on both the USGEO, which is charged with developing the U.S. Integrated Surface Observing System (ISOS), and the GEO, which is developing the Global Earth Observation System of Systems (GEOSS).
The Department utilizes several strategies identified in the five-year NOAA strategic plan to assist customers in better understanding the impacts of climate change and variability. Like weather, improved climate information can have a profound impact on the economy, and the Department strives to ensure that reliable, unbiased climate information is available for informed and reasoned decision-making. Strategies to achieve this end state include:
NOAA will continue to strive toward an integrated approach in the provision of environmental information and modeling as described in the climate-related aspects of the U.S. Integrated Earth Observation System (IEOS) Strategic Plan. In response to the Ocean Research Priorities Plan, NOAA will enhance its ocean focus to provide understanding of climate impacts on ecosystems. These focus areas will increase the progress of the Climate Goal to integrate observations, data management, and modeling, as well as provide a new suite of environmental products and services.
As the 21st century unfolds, new priorities for NOAA action are emerging in the areas of climate change, freshwater supply, and ecosystem management. In recent years, extreme drought and flooding conditions in large regions of the Nation have combined to make improved water resources prediction an urgent requirement for the Department’s future weather and climate mission.
NOAA’s challenge will be to continue to improve critical services to the Nation, including (1) advancing science to improve water resource forecasting and service delivery; (2) improving NOAA’s tsunami detection, warning, and mitigation capabilities and expanding its scope from the Pacific to the Atlantic and Caribbean; (3) conducting research to yield improvements in the accuracy of one-day to two-week high-impact weather forecasts; (4) improving international efforts to address medium range forecasting and climate variability; (5) expanding ozone air quality forecast to the rest of the Nation; and (6) improving operational atmospheric, ocean, and coastal modeling capabilities.
Society will continue to face major challenges in which the influence of climate will be a fundamental factor. Reducing climate-related uncertainties in policy and decision-making can be valued at more than $100 billion for the United States alone, and relatively small increases in accuracy can yield substantial benefits. In the next five years and beyond, NOAA’s climate priorities and outcomes will lead to science-based climate information services as envisioned by the U.S. CCSP and as needed to meet NOAA’s commitments to deliver climate information services to the Nation. To this end, NOAA’s research activities will be expanded beyond traditional research efforts supporting the provision of climate data, summaries, and forecasts to address the increasing demand for research on, and assessments of, the impacts of climate on livelihoods, health, safety, and quality of life.